Crypto exchanges have become the backbone of digital finance. They power trillions in daily volume and support investments from retail traders to institutions. From enabling cross‑border payments to facilitating token launches, they reshape how assets move and grow. Explore how these platforms drive everything from portfolio access to global liquidity.
Editor’s Choice
As of 2025, there are over 248 listed spot crypto exchanges, though only around 200–220 appear consistently active in terms of volume and listings.
As of mid-2025, the global crypto market cap hovers around $2.7 trillion, showing a pullback from late 2024 highs that approached $4 trillion.
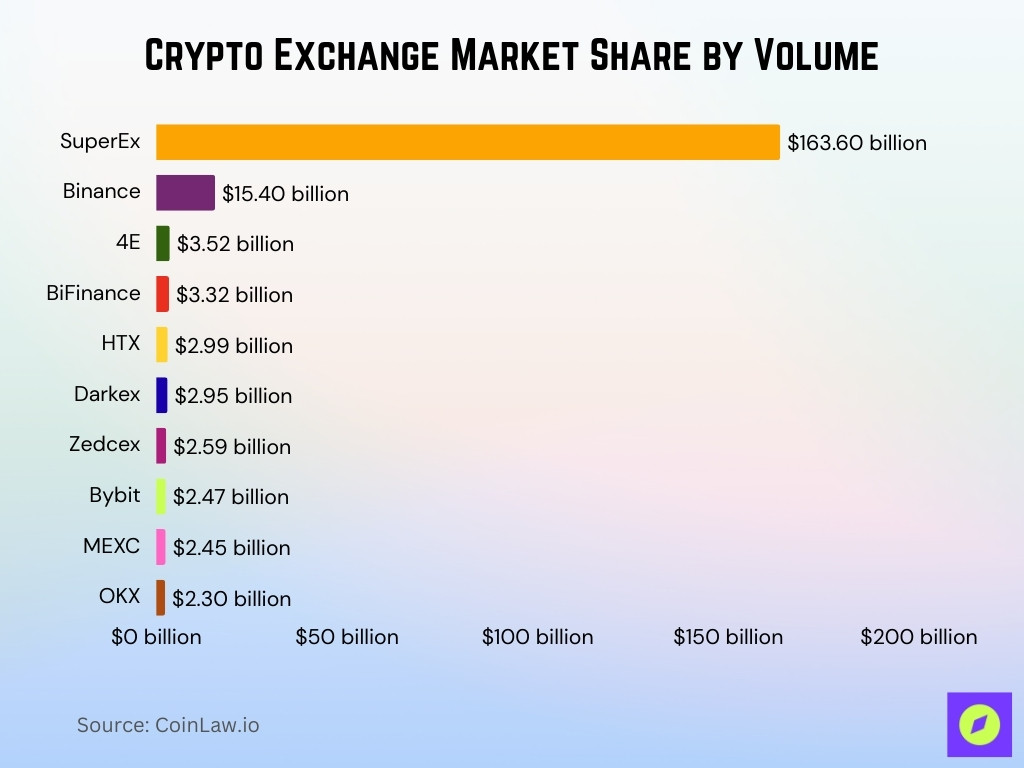
SuperEx handles $163.6 billion in 24‑hour volume, over 10× that of Binance at $15.4 billion.
H1 2025 saw total exchange trading volume reach $9.36 trillion, the strongest first half since 2021.
The crypto exchange market revenue is projected to reach between $54 billion and $71 billion in 2025, depending on growth assumptions and institutional adoption rates.
Estimates suggest the crypto exchange market may grow from ~$50 billion in 2024 to over $60 billion in 2025, depending on trading activity, user base, and institutional involvement.
Among the top 10 centralized exchanges, Binance controls 39.8% of market share in mid‑2025.
Recent Developments
Seven of the top 10 exchanges saw Q2 trading volume drop by 27.7%, equating to a $1.5 trillion decline.
Crypto.com led losses with a 61.4% drop in Q2 volume.
Binance lost 6 percentage points in H1 2025 market share, now at 37%.
Bybit fell by 0.9 percentage points, now at a 7.6% share in H1.
OKX and Coinbase also slipped by 0.6% and 0.5%, respectively.
Huobi bucked the trend, gaining 1% year‑over‑year, hitting a 5.5% share.
Exchange revenue projections grew in lockstep with user demand, pointing to robust future expansion trends.
Monthly trading volumes peaked early in 2025, with January at $2.3 trillion and February at $1.7 trillion.
Best Known Cryptocurrencies
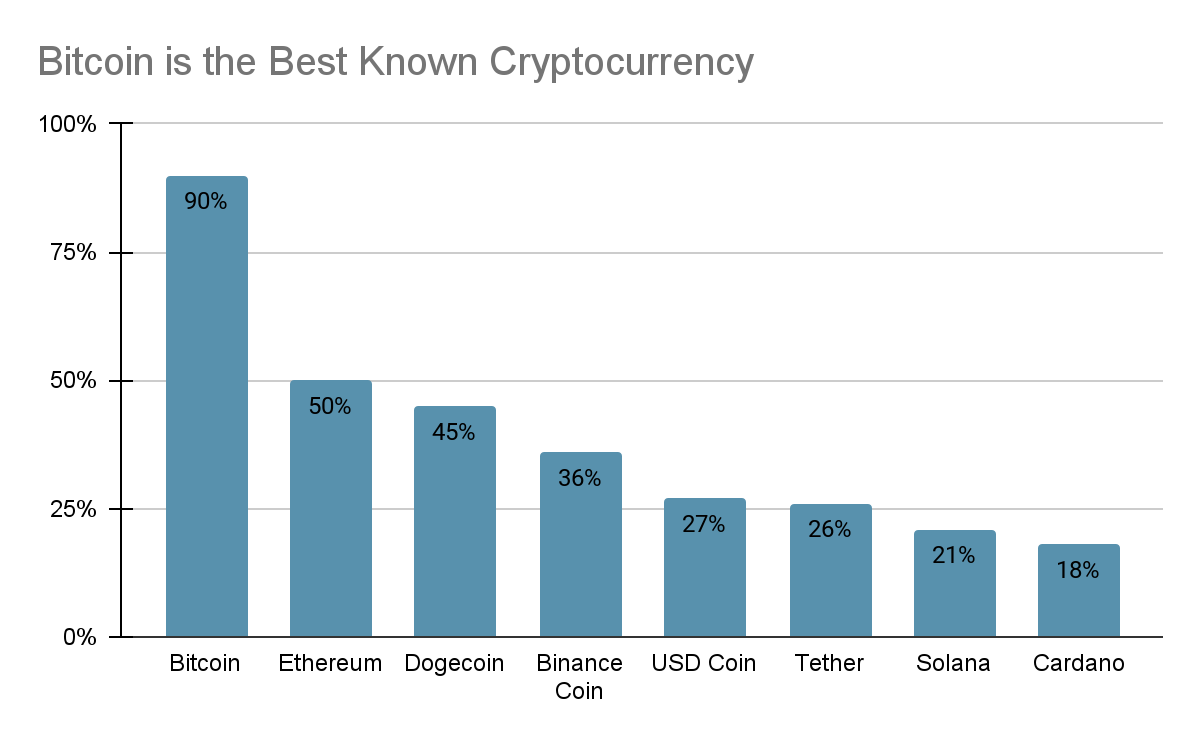
Bitcoin leads recognition with 90% awareness, making it the most widely known cryptocurrency.
Ethereum holds the second spot at 50% awareness, half the recognition of Bitcoin.
Dogecoin follows closely with 45% awareness, showing strong visibility despite its meme origins.
Binance Coin is known by 36% of respondents, placing it in the mid-tier range.
USD Coin achieves 27% awareness, just ahead of Tether at 26%, reflecting the presence of stablecoins.
Solana registers 21% awareness, showing growing recognition in the market.
Cardano rounds out the list with 18% awareness, still maintaining notable recognition among users.

Global Number of Crypto Exchanges
There are 217 active crypto exchanges worldwide as of 2025.
CoinMarketCap lists about 248 spot exchanges, though 24-hour volume as of mid-2025 is closer to $100–150 billion, not $2.1 trillion. The $2.1 trillion figure may reflect longer timeframes or include derivatives.
Major players include SuperEx, Binance, 4E, BiFinance, HTX, Darkex, Zedcex, Bybit, MEXC, and OKX.
The top 10 exchanges combined exceed $203 billion in a single day.
Centralized exchanges maintain dominance, but competition from DeFi venues is increasing.
Regional licensing and regulations influence active exchanges, particularly in the U.S., EU, and Asia.
Market consolidation is visible, with top exchanges maintaining a strong share despite broader ecosystem growth.
Exchange count still grows, but many new listings focus on niche or regional markets.
Trading Volume Statistics
H1 trading volume across exchanges: $9.36 trillion, the highest since 2021.
January 2025: $2.3 trillion, February: $1.7 trillion, the first two months set a strong pace.
March fell to $1.45 trillion (41% YoY), April: $1.28 trillion (19% YoY).
May rebounded to $1.47 trillion, a 15% MoM rise.
Combined spot and derivatives dip: February recorded $7.20 trillion, down 20.6%, the lowest since October.
Top 4 exchanges (Binance, Coinbase, Bybit, OKX) all saw shrinking shares in 2025.
Overall market share: Binance (39.8%), MEXC (8.6%), Gate (7.8%), Bitget (7.6%), Bybit (7.2%), Upbit (6.3%).
SuperEx stands out with a single-day volume of $163.6 billion.
Market Capitalization Data
Total crypto market cap in 2025: $2.96 trillion.
That marks a pullback from a late‑2024 high of $4 trillion.
From a 2017 baseline of approximately $100 billion, the crypto market cap has expanded more than 25× to over $2.5 trillion by mid-2025.
Bitcoin and Ethereum jointly account for ~75% of the total market cap.
Concentration around high-cap assets persists, reflecting a non‑diversified market.
Market cap volatility remains pronounced, tied closely to macro trends and regulatory headlines.
Despite cooling from the peak, the ecosystem continues to scale in both value and breadth.
Growth in market cap supports expanded services such as staking, lending, and institutional custody.
Exchange Rankings by Volume
SuperEx dominates with $163.6 billion in 24h volume.
Binance lags with $15.4 billion, making it #2 by volume alone.
Other top performers: 4E: $3.52B, BiFinance: $3.32B, HTX: $2.99B, Darkex: $2.95B, Zedcex: $2.59B, Bybit: $2.47B, MEXC: $2.45B, OKX: $2.30B.

Daily combined volume of the top 10 exceeds $203 billion.
CoinMarketCap tracks ~248 exchanges with $2.1 trillion in 24h total volume.
Market share in mid‑2025: Binance (39.8%), MEXC (8.6%), Gate (7.8%), Bitget (7.6%), Bybit (7.2%), Upbit (6.3%), OKX (6.0%), HTX (5.8%), Coinbase (5.8%), Crypto.com (5.1%).
Despite shifts, Binance remains dominant, though its share is receding under competitive pressure.
Revenue of Crypto Exchanges
Gemini reported a net loss of $282.5 million in H1 2025 on revenue of $68.6 million, compared to a $41.4 million loss on $74.3 million revenue in H1 2024.
Coinbase’s quarterly revenue dropped 26% sequentially to $1.5 billion, below analysts’ expectations of $1.59 billion.
Business of Apps estimates the global crypto exchange platform market revenue at $45.3 billion in 2025.
The Business Research Company projects growth from $43.8 billion in 2024 to $54.8 billion in 2025, driven by broader adoption.
North America is expected to generate over $11.9 billion in exchange platform revenue in 2025, with the U.S. accounting for nearly $9.5 billion.
Europe is forecasted to contribute around $6.08 billion, while Asia-Pacific adds about $7.45 billion to total revenue.
Gemini’s deteriorating fundamentals contrast with peers like Coinbase, which remain profitable and publicly traded.
Bullish entered the NYSE with a staggering valuation of $13.2 billion, signaling investor confidence in crypto exchanges as public companies.
Public Opinion on Cryptocurrency as a Legitimate Investment
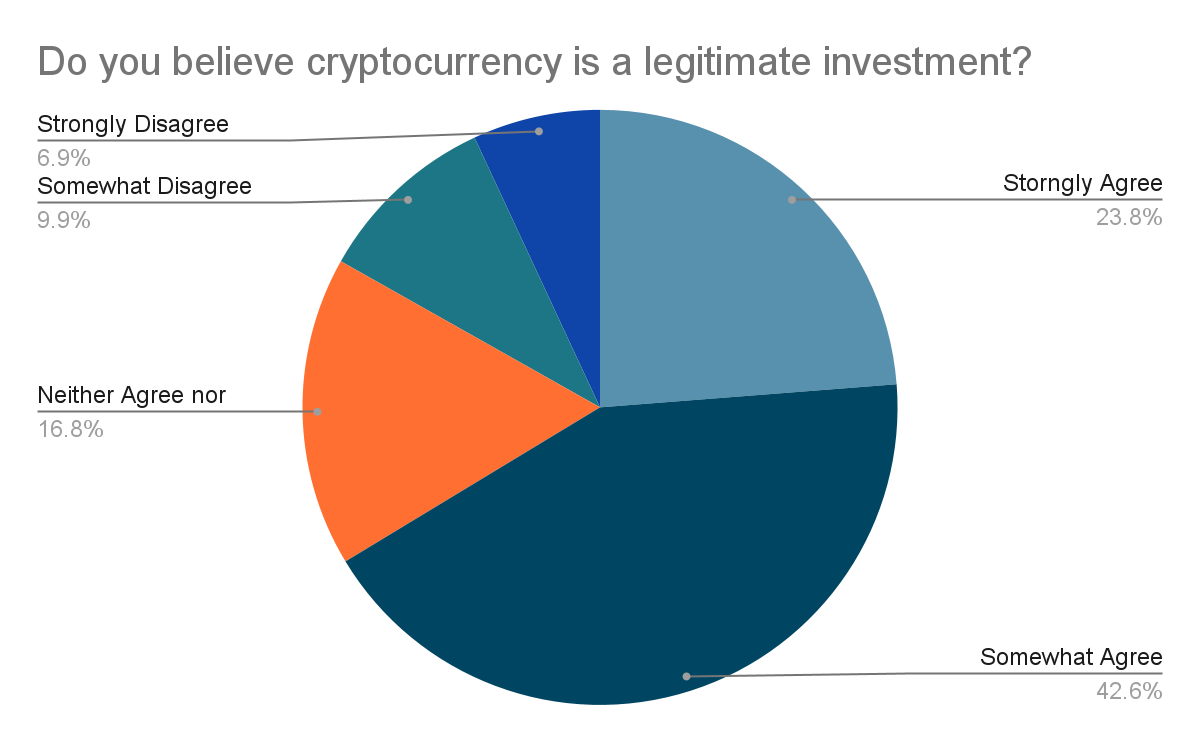
42.6% of respondents Somewhat Agree that cryptocurrency is a legitimate investment, forming the largest share.
23.8% Strongly Agree, showing nearly one in four hold high confidence in crypto as an investment.
16.8% neither agree nor disagree, reflecting a cautious or undecided stance.
9.9% Somewhat Disagree, signaling skepticism among a smaller group.
6.9% Strongly Disagree, representing a minority that firmly rejects cryptocurrency as a valid investment option.

Number of Active Users
Over 560 million crypto owners exist globally in 2025, a 34% increase from 420 million in 2024.
The number of crypto users worldwide is projected to reach 861 million in 2025.
The U.S. will have nearly 100 million crypto users in 2025, a significant portion of global adoption.
Europe is expected to exceed 218 million crypto users in 2025.
Coinbase alone serves over 108 million customers by 2024, reinforcing its role as a major user gateway.
Coinbase reports 10.8 million active monthly transacting users.
KuCoin counts over 40 million users across 200 countries and regions as of 2025.
Börse Stuttgart Digital had around 1 million end-users in 2024, showing crypto adoption permeating traditional finance channels.
User Base and Adoption Stats
Global crypto ownership penetration averages 6.8% as of 2024, equivalent to 560 million owners.
Smartphone trading dominates, with over 70% of crypto users now operating via mobile-first apps, highlighting the sector’s shift to app-based access.
Institutional sentiment shows 57% of investors are bullish on increasing crypto allocation by the end of 2024.
Gemini’s 2025 Global State of Crypto survey spans the U.S., UK, France, Italy, Singapore, and Australia via 7,205 respondents.
Growth from 420 million to 560 million users between 2024 and 2025 marks rapid adoption, nearly 34% growth.
In the U.S., adoption closely follows overall platform growth trends, as evidenced by nearly 100 million users expected in 2025.
Smartphone usage trends are particularly pronounced among younger and rural demographics, expanding the market reach.
Overall, both retail and institutional usage continue to drive broader mainstream penetration.
Total Value Locked (TVL) Concentration by Blockchain
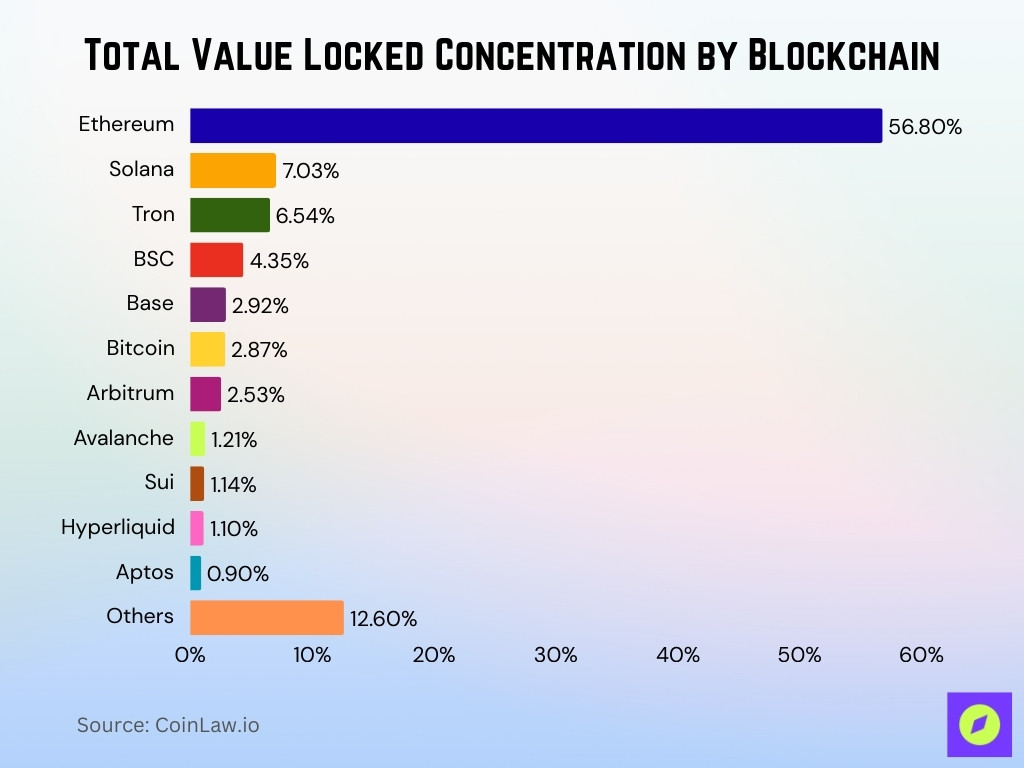
Ethereum dominates with 56.8% of total value locked, making it the clear leader in decentralized finance.
Solana holds 7.03%, emerging as the second-largest chain by TVL.
Tron accounts for 6.54%, maintaining a significant share.
BSC (Binance Smart Chain) captures 4.35%, continuing its role as a key DeFi chain.
Base and Bitcoin contribute 2.92% and 2.87% respectively, showing moderate adoption in TVL.
Arbitrum records 2.53%, highlighting growth among Ethereum Layer-2 solutions.
Avalanche (1.21%), Sui (1.14%), Hyperliquid (1.1%), and Aptos (0.9%) hold smaller but notable shares.
Other blockchains collectively make up 12.6%, showing the fragmented nature of the remaining ecosystem.

Supported Cryptocurrencies
As of 2025, there are 17,151 cryptocurrencies in existence, though most have low liquidity or market relevance.
Exchanges typically support dozens to hundreds of assets, with platforms like Gemini offering over 70 cryptocurrencies across 60+ countries.
KuCoin offers trading in many digital assets and has added tokenized equities (“xStocks”) to its offerings in 2025.
Established exchanges maintain broad asset libraries to cater to both major and niche market demands.
Asset proliferation challenges exchanges to balance breadth with compliance and liquidity.
Many exchanges now categorize and curate supported tokens to guide user choices.
DeFi growth continues to pressure exchanges to list more altcoins and experimental tokens.
Some platforms increasingly focus on regulated token sets to mitigate listing risks.
Fee Structure Statistics
Fee models generally include trading, deposit, withdrawal, and listing fees.
Many platforms now offer tiered maker/taker structures to reward volume.
Subscription models (e.g., Coinbase One) and staking services add alternative fee streams.
Fee transparency has become a user concern, prompting exchanges to publish fee calculators.
Mobile-focused exchanges often highlight low or flat-rate fees to attract retail users.
Regulatory pressure continues to shape disclosures around fee structures.
Fee differentiation by region is common due to varying liquidity and regulation.
Data on average exchange fees in 2025 remains scattered and requires consolidated reporting.
Geographic Distribution of Users
North America leads revenue share, generating nearly $11.9 billion in crypto exchange platform income in 2025.
The U.S. contributes around $9.5 billion of that figure, reflecting its dominant market position.
Europe accounts for approximately $6.08 billion, while Asia-Pacific delivers $7.45 billion.
Smartphone usage for trading is especially strong among younger, rural populations globally.
Coinbase’s 108 million users span over 100 countries.
KuCoin covers 200 countries and regions, with over 40 million users.
Börse Stuttgart Digital anchors crypto services in Germany and the EU via regulated infrastructure.
Adoption continues expanding across emerging markets as access improves.
Exchange Reserves and Security Metrics
Bybit suffered a major hack in February 2025, $1.4 billion was stolen, and it was later replenished via emergency funding.
KuCoin resolved an unlicensed operations case in 2025 by paying nearly $300 million in fines.
Regulators continue to scrutinize reserve transparency and custody models, though standardized metrics remain limited.
Leading exchanges are increasingly publishing proof-of-reserves data.
Insurer-backed reserves and third-party audits are emerging as trust signals.
Reserve ratios and liquidity buffers remain central to platform integrity.
Future reporting is likely to trend toward enhanced transparency mandates.
Security Incident Statistics
By mid-2025, total crypto thefts soared past $2.17 billion, already exceeding the total for all of 2024.
The Bybit hack alone accounted for roughly $1.5 billion, marking the largest exchange breach to date.
CoinDCX suffered a $44 million breach in July 2025.
CertiK reports 344 security incidents in H1 2025, with average losses per incident at $7.18 million.
A global survey found that 63% of exchanges increased their cybersecurity budgets in 2025, yet 31% still experienced breaches.
Hack vectors varied, malware intrusions rose 26%, and SIM‑swap attacks contributed to 19% of major hacks.
Notably, Lazarus Group continues targeting exchanges worldwide, such as WazirX’s $234.9 million hack in 2024 and Bybit in 2025.
Deposit and Withdrawal Volumes
Deposits and withdrawals remain key liquidity metrics, though public aggregation is sparse.
Exchanges monitor withdrawal patterns closely after security incidents like Bybit’s February hack.
Institutional custody frameworks now require clearer auditing of fund movements.
Some exchanges provide API access for deposit volumes, aiding transparency.
Regulatory proposals aim to mandate disclosures on asset flows in and out of exchanges.
Monitoring of net flows into ETPs provides indirect insight into institutional withdrawal behavior.
Mobile app trends suggest increasing use of wallet-to-exchange transfers among retail traders.
Stablecoin Flows
In 2024, stablecoin transactions reached $23 trillion for USDT and USDC combined, a 90% increase from 2023.
H1 2025 alone saw $4.6 trillion in stablecoin flows across about 1 billion transactions, signaling rapid usage growth.
The total stablecoin market cap surpassed $230 billion by Q2 2025, with USDT accounting for 65%, USDC 26%.
Stablecoin supply reached $247 billion by May 2025, marking a 54% increase from the previous year.
Cross-border payments drive stablecoin adoption, with 71% in Latin America using stablecoins for remittance purposes.
90% of firms are deploying stablecoin infrastructure, with speed (48%) and security (36%) cited as top priorities.
Banks like Citigroup are developing stablecoin custody and payment offerings amid regulatory shifts.
Liquidity Metrics
Top-tier exchanges (just 19% of all assessed platforms) command over 60% of global spot trading volume.
Between 2024 and mid‑2025, exchange rankings improved, and 19 platforms achieved BB+ ratings or higher (up from 16).
Over 50% of benchmarked exchanges now operate under some form of regulatory license.
On-chain liquidity metrics, including exchange balances and net flows, are critical to tracking capital movement but require premium access.
DEX share of spot trading has climbed to ~11%, reflecting growing DeFi traction.
Institutional-grade liquidity data, covering bid-ask spreads and depth, is increasingly available via analytics platforms.
Liquidity tightness remains a key determinant of exchange resilience during market stress.
On‑Chain Metrics
Mobile wallet users topped 35 million in 2025, driven by the broad adoption of apps like Coinbase Wallet and MetaMask.
Glassnode provides critical on-chain insights, such as capital flows, supply dynamics, and miner behavior, but detailed adoption data is proprietary.
Coin Metrics reports growing visibility into miner revenues and exchange flows, vital for understanding Bitcoin’s on‑chain health.
On-chain metrics signal investor sentiment, e.g., net positions and HODL waves, enabling smarter market analysis.
ETP net flows for BTC (≈515,000 BTC) and ETH (611,000 ETH) reflect increasing institutional custody demand.
DEX usage offers insights into decentralized liquidity patterns versus centralized flows.
Such data helps predict market behavior during volatility, technological shifts, or regulatory events.
Institutional vs. Retail Usage
Less than 5% of spot Bitcoin ETF holdings are tied to long-term institutions (e.g., pensions), and 10–15% are held by hedge funds or wealth managers.
Despite institutional gains, retail investors dominate crypto ETF ownership today.
Global net inflows into crypto ETFs recently hit $4 billion, the highest level so far in 2025.
Institutional interest manifests through treasury strategies, and public firms are adding Bitcoin to corporate balance sheets.
However, mainstream institutional participation remains nascent, pending clearer stablecoin and digital asset frameworks, like the GENIUS Act.
Retail continues to drive day-to-day trading, especially via mobile and app-based platforms.
Tools that analyze on-chain data now help institutions navigate the space with greater reliability.
Conclusion
Crypto exchanges today are at a crossroads, with security threats, stablecoin expansion, and institutional interest defining the landscape. Breaches surpassed $2 billion, pushing platforms to invest heavily in protection. Meanwhile, stablecoins crossed $230 billion in market value, facilitating trillions in flows and gaining legitimacy through regulatory clarity like the GENIUS Act. Liquidity is consolidating in top platforms, while on-chain metrics and institutional tools shape evolving market transparency. Retail still leads in volume and engagement, but institutions are steadily growing. Together, these trends show a market maturing, complex yet actionable, volatile yet full of potential.


