Key takeaways
By 2025, Decred’s maximum price could rise to $20.56.
The token could reach as high as $62.54 in 2028.
By 2031, DCR is expected to trade at a maximum price of $192.64.
Decred (DCR) is making waves in the crypto world, focusing on security and scalability and giving its community a real say in decisions. In recent times, it rolled out updates like improved privacy features and upgrades to its decentralized exchange, DCRDEX, which caught the attention of many. Thanks to its unique mix of Proof-of-Work and Proof-of-Stake, Decred has built a reputation as a solid and innovative project.
Let’s examine how its latest moves and market trends might impact its price in the future.
Overview
| Cryptocurrency | Decred |
| Token | DCR |
| Price | $15.83 |
| Market Cap | $268.31M |
| Trading Volume | $3.85M |
| Circulating Supply | 16.93M DCR |
| All-time High | $250.02 (Apr 16, 2021) |
| All-time Low | $0.3948 Dec 28, 2016 |
| 24-h High | $16.59 |
| 24-h Low | $15.12 |
Decred price prediction: Technical analysis
| Metric | Value |
| Price Prediction | $ 16.22 (2.74%) |
| Volatility (30-day Variation) | 4.60% |
| 50-day SMA | $ 15.68 |
| 14-Day RSI | 46.50 |
| Sentiment | Neutral |
| Fear & Greed Index | 74 (Greed) |
| Green days | $ 13.59 |
Decred price analysis: DCR shows signs of consolidation with a tight range between support and resistance
range-bound movement DCR is stuck between $15.66 and $16.09, showing indecision and lack of clear momentum.
Strong resistance at $16.09 multiple failed attempts to break $16.09 confirm strong seller presence.
Support holding at $15.66 price consistently bounces from $15.66, signaling buyer interest at lower levels.
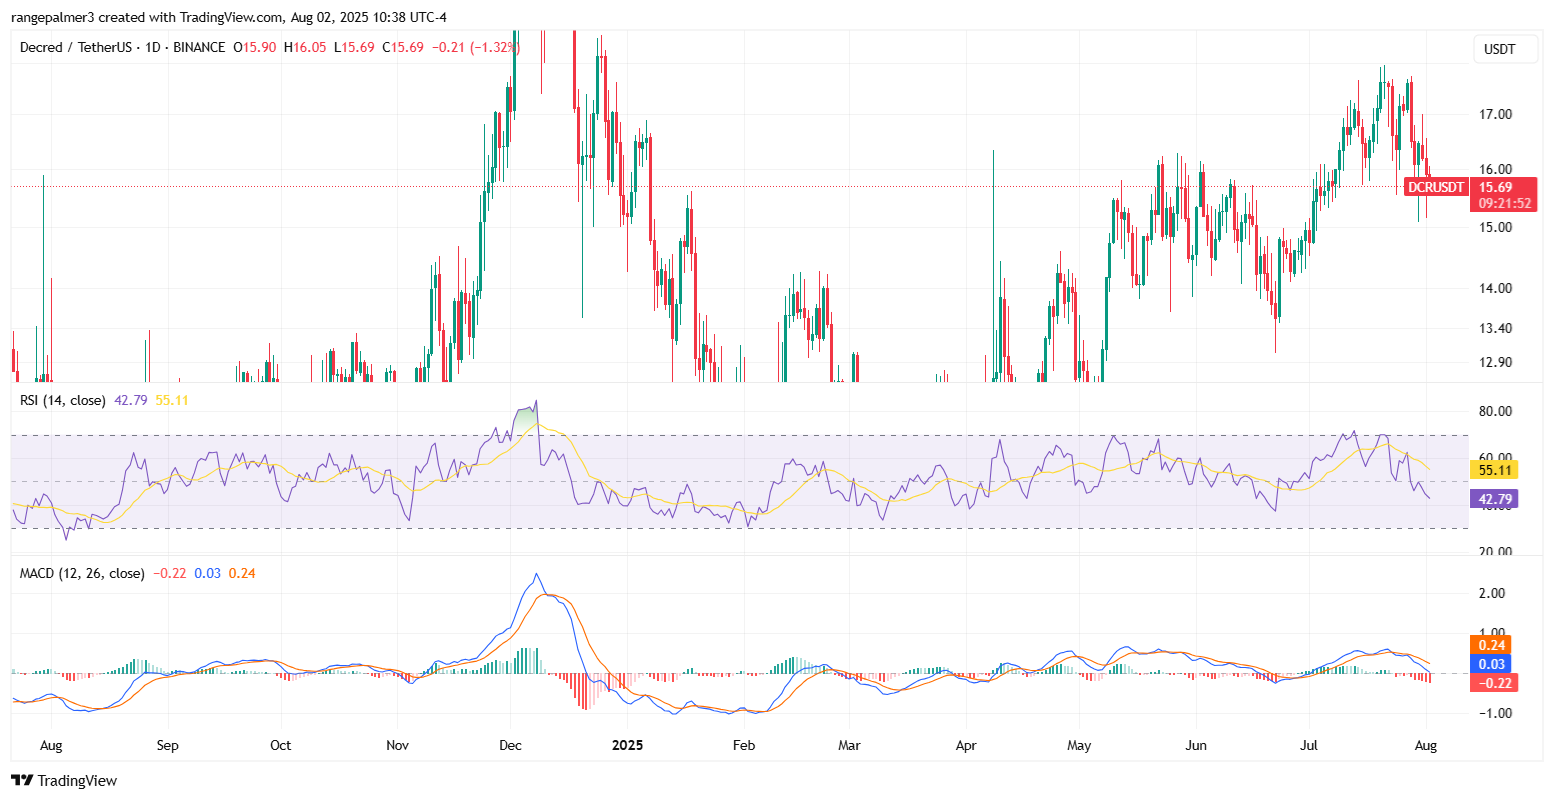
August 2, 2025, Decred (DCR) is trading at $15.76, showing a 0.88% decline over the past 24 hours. The cryptocurrency is currently moving sideways, caught between a strong resistance at $16.09 and support at $15.66. With no clear breakout, the price remains stable within this range. DCR is still down 93.68% from its all-time high of $250.02, reached on April 17, 2021, but it is up 3902.82% from its all-time low of $0.3948 set on December 28, 2016.
Decred 1-day timeframe: DCR struggles to break resistance as consolidation continues
The daily chart for Decred shows a tight trading band with no breakout in sight. The price ranges between $15.66 and $16.09, reflecting a clear lack of directional bias. Attempts to breach $16.09 have failed multiple times, indicating heavy resistance at that level. This level has become a short-term ceiling that bulls have yet to reclaim.

DCR/USDT Chart: TradingView
The Relative Strength Index (RSI) hovers near 50, showing no signs of bullish or bearish divergence. The MACD is flat, suggesting a pause in the trend. Unless volume and volatility pick up, DCR is likely to remain trapped in this range. A breakout or breakdown from this channel will likely dictate the direction of the short-term trend.
Decred 4-hour timeframe: DCR price compression points to imminent move
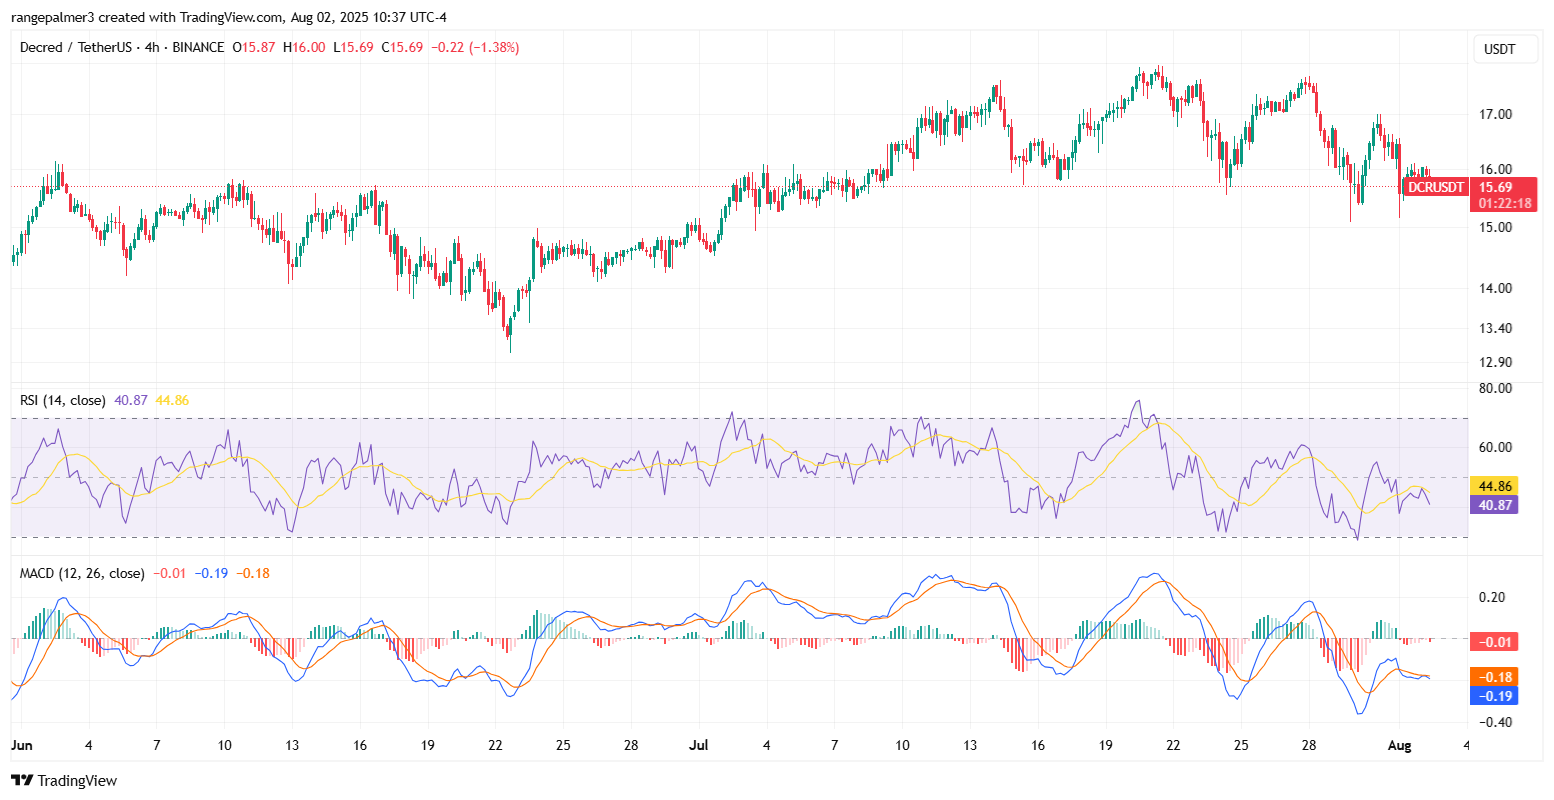
On the 4-hour chart, DCR is trading near the lower boundary of the range, with several failed wicks above $16.00 highlighting weak bullish momentum. Price has tested the resistance area multiple times but lacks the volume to sustain upward moves.

DCR/USDT Chart: TradingView
Support at $15.66 remains active, absorbing repeated sell-offs and forming a base. Price is compressing between lower highs and horizontal support, a pattern that often precedes a breakout. Market participants are likely awaiting a volume spike before committing to positions
Decred technical indicators: Levels and action
Daily simple moving average (SMA)
| Period | Value | Action |
| SMA 3 | $ 14.86 | BUY |
| SMA 5 | $ 15.87 | SELL |
| SMA 10 | $ 16.40 | SELL |
| SMA 21 | $ 16.64 | SELL |
| SMA 50 | $ 15.68 | BUY |
| SMA 100 | $ 15.11 | BUY |
| SMA 200 | $ 13.59 | BUY |
Daily exponential moving average (EMA)
| Period | Value | Action |
| EMA 3 | $ 16.39 | SELL |
| EMA 5 | $ 15.94 | SELL |
| EMA 10 | $ 15.05 | BUY |
| EMA 21 | $ 13.89 | BUY |
| EMA 50 | $ 13.03 | BUY |
| EMA 100 | $ 13.12 | BUY |
| EMA 200 | $ 13.65 | BUY |
What to expect from Decred
Decred (DCR) remains range-bound, trading between $15.66 support and $16.09 resistance, with no strong directional bias in the short term. The tight consolidation on both the daily and 4-hour charts suggests that a breakout or breakdown is likely in the near future. Price compression and repeated tests of both support and resistance levels indicate that momentum is building behind the scenes.
If buyers manage to push DCR above the $16.09 resistance, the next short-term target could extend toward $16.50–$17.00. However, failure to break this level and a drop below $15.66 could open the door to downside moves, possibly toward $15.20 or lower. For now, traders should watch for increased volume and volatility as signals for the next decisive move.
Is Decred a good investment?
Decred (DCR) is a project known for its hybrid proof-of-work and proof-of-stake governance model, offering strong community involvement and decentralized decision-making. While the current price action shows limited short-term momentum, the long-term fundamentals remain intact, particularly for investors who value on-chain governance and sustainability in blockchain protocols.
That said, with DCR still down over 93% from its all-time high, the token remains in a prolonged bear phase. Short-term traders may find opportunities in volatility, mainly if a breakout above $16.09 occurs. However, for long-term investors, whether DCR is a good investment depends heavily on one’s belief in the project’s technical direction, governance structure, and real-world utility within the evolving crypto ecosystem.
In summary, Decred offers strong fundamentals but weak near-term price action. Caution is advised, and potential investors should consider broader market conditions and risk tolerance before entering.


