XRP is standing at a decisive price crossroads, as the cryptocurrency struggles to hold critical support levels while traders brace for heightened volatility.
Technical signals point to a potential 20% downside in the near term, but a well-defined bull flag pattern suggests that a major breakout toward $5 could follow if support holds firm.
XRP Holds Key Support at $2.80 Amid Bearish Pressure
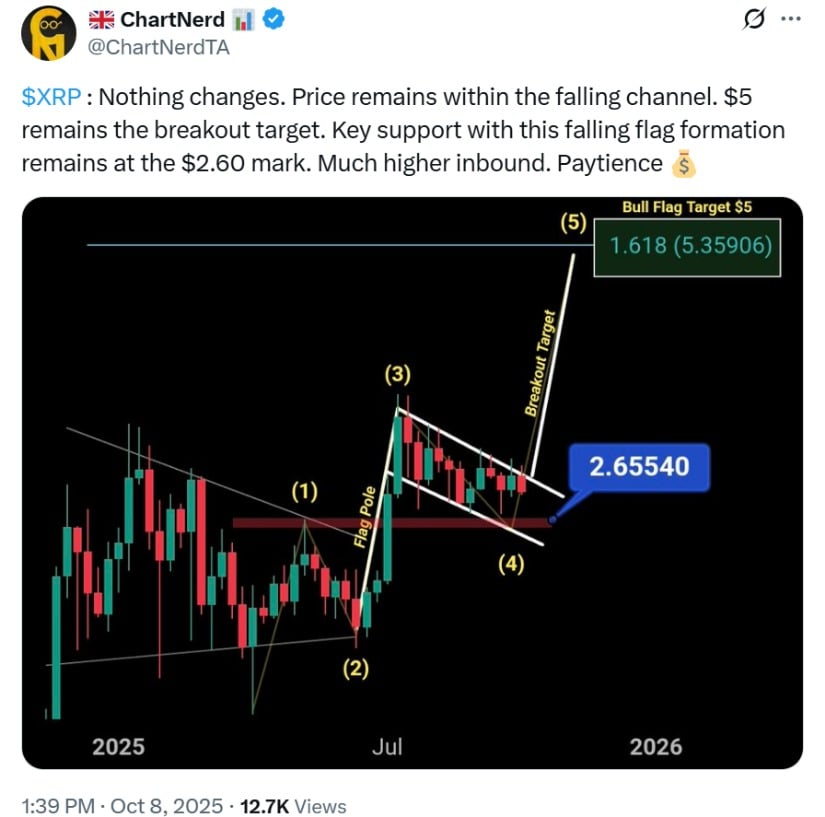
The XRP price today hovers near $2.80 after recent selling pressure tested key support zones. According to technical analyst ChartNerdTA, the weekly chart highlights a bull flag pattern within a falling channel, projecting a potential $5 upside target if XRP can sustain its base.

XRP continues to trade within its falling channel, holding key support at $2.60 while maintaining a $5 breakout target. Source: @ChartNerdTA via X
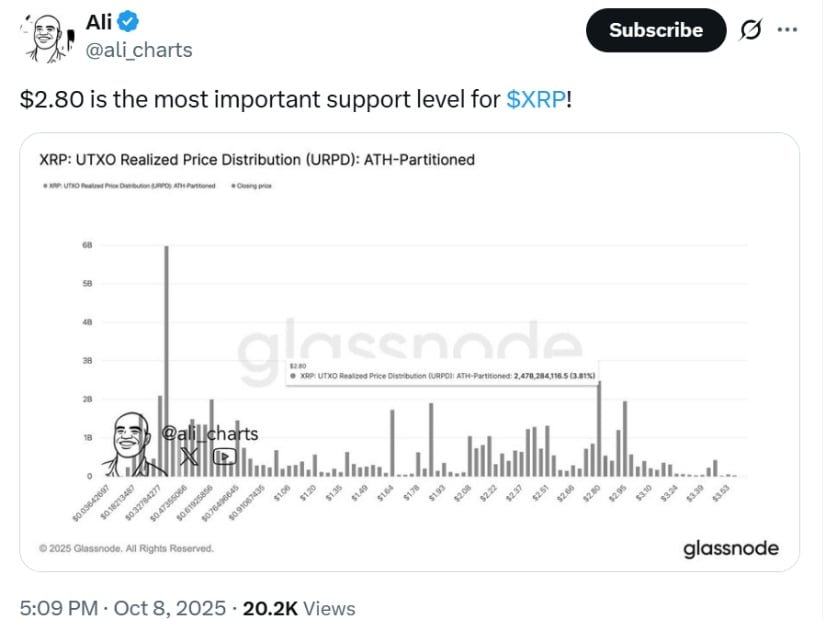
The $2.66–$2.80 zone remains a major accumulation level, reinforced by on-chain data. Analyst Ali noted that “UTXO Realized Price Distribution shows a dense cluster of cost bases around $2.80, reflecting where a large number of holders entered the market.” Historically, such price clusters have acted as a strong demand zone, reducing the risk of prolonged downside moves.
However, bearish sentiment is also gaining traction. Veteran trader Peter Brandt flagged the possibility of a 20% pullback, warning that “a break below $2.70 could expose XRP to a deeper correction, especially if broader market headwinds persist.”
Lower Highs Raise Red Flags for Bulls
Despite bullish technical setups, XRP’s recent behavior has shown signs of weakening momentum. Since July, every rally in Bitcoin has triggered a smaller move in XRP, with each peak coming in lower than the last.

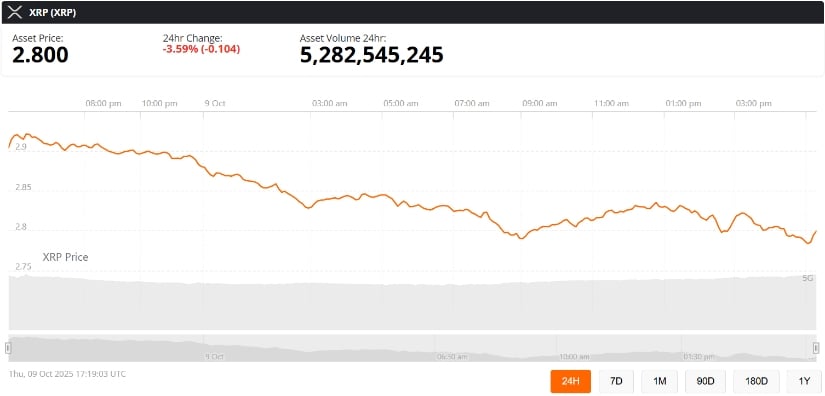
XRP was trading at around $2.80, down 3.59% in the last 24 hours at press time. Source: XRP price via Brave New Coin
This weakening structure is visible on the XRP chart, with price failing to reclaim the $3.19 September high and stalling at $3.10 earlier this week. If this pattern persists, it could set the stage for a short-term dip below $2.70.
MACD Histogram Signals Strengthening Bearish Momentum
Technical indicators also reflect this pressure. The weekly MACD histogram has dipped deeper below the zero line, signaling stronger bearish momentum. This suggests sellers are gaining the upper hand in the short term, despite the broader bullish structure forming on the longer timeframe.
“Momentum is shifting against XRP in the near term,” Godbole noted. “To reverse this setup, XRP must reclaim the $3.10 resistance with convincing volume. Otherwise, the next test could come closer to $2.00.”
Such a move would align with historical behavior, where Ripple XRP has shown sharper reactions to Bitcoin downturns compared to its upside rallies.
Bitcoin Rally Fuels Volatility for XRP
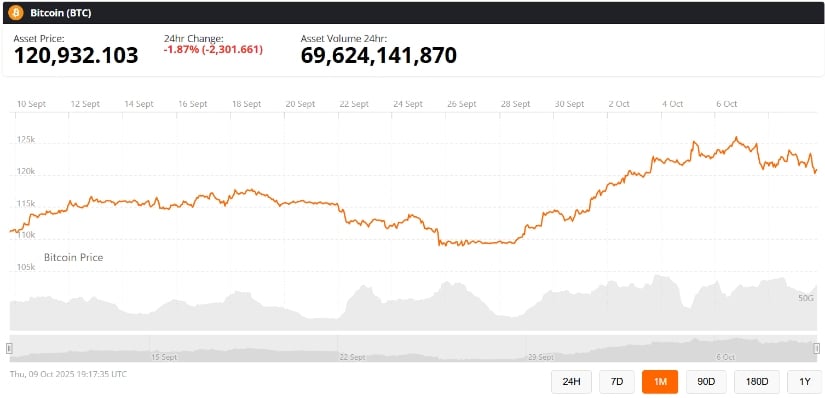
XRP’s price movements remain tightly linked to Bitcoin’s trajectory. The leading cryptocurrency’s surge to a new all-time high of $126,000 in late September lifted the altcoin market—but XRP lagged behind, underscoring its relative weakness.

Bitcoin (BTC) price was holding the $120K support while writing this report. Source: Bitcoin Price via Brave New Coin
Alternative cryptocurrencies typically track Bitcoin’s broader direction, but their magnitude of swings often differs. In this cycle, Bitcoin has rallied aggressively, while XRP’s upside has been muted, creating what analysts describe as a “lagging pattern.”
This divergence highlights XRP’s heightened sensitivity to market corrections. A pullback in Bitcoin could easily spill over into the XRP market, amplifying downside risks before any sustainable breakout.
Bull Flag Still in Play: A Path Toward $5
Despite short-term weakness, XRP still holds a potentially powerful bullish setup on higher timeframes. The bull flag pattern on the weekly chart continues to project a $5 upside target if support holds and price breaks upward.
“XRP is at a critical turning point,” ChartNerdTA commented. “If buyers defend $2.66 and push past $3.10, the pattern’s breakout target could take XRP toward $5 in the next major rally.”
This scenario aligns with broader XRP price prediction 2025 models, which highlight bullish potential once macro pressures ease and liquidity flows return to the altcoin sector.
Final Outlook: Risk of Dip Before Reversal
For now, the current XRP price is stuck between a strong support zone and rising bearish momentum. Analysts agree that while a 20% correction cannot be ruled out, this could ultimately set the stage for a strong bullish reversal toward the $5 level.

$2.80 remains the critical support level for XRP. Source: Ali Martinez via X
In short, XRP’s price action remains at a make-or-break point. A clean break below $2.66 would confirm the bearish scenario, but holding this level could ignite the next major breakout.
As the market awaits XRP’s next move and broader risk sentiment, traders are watching these levels closely. Whether XRP price dips further or breaks higher, the next few weeks could prove decisive for its 2025 trajectory.


