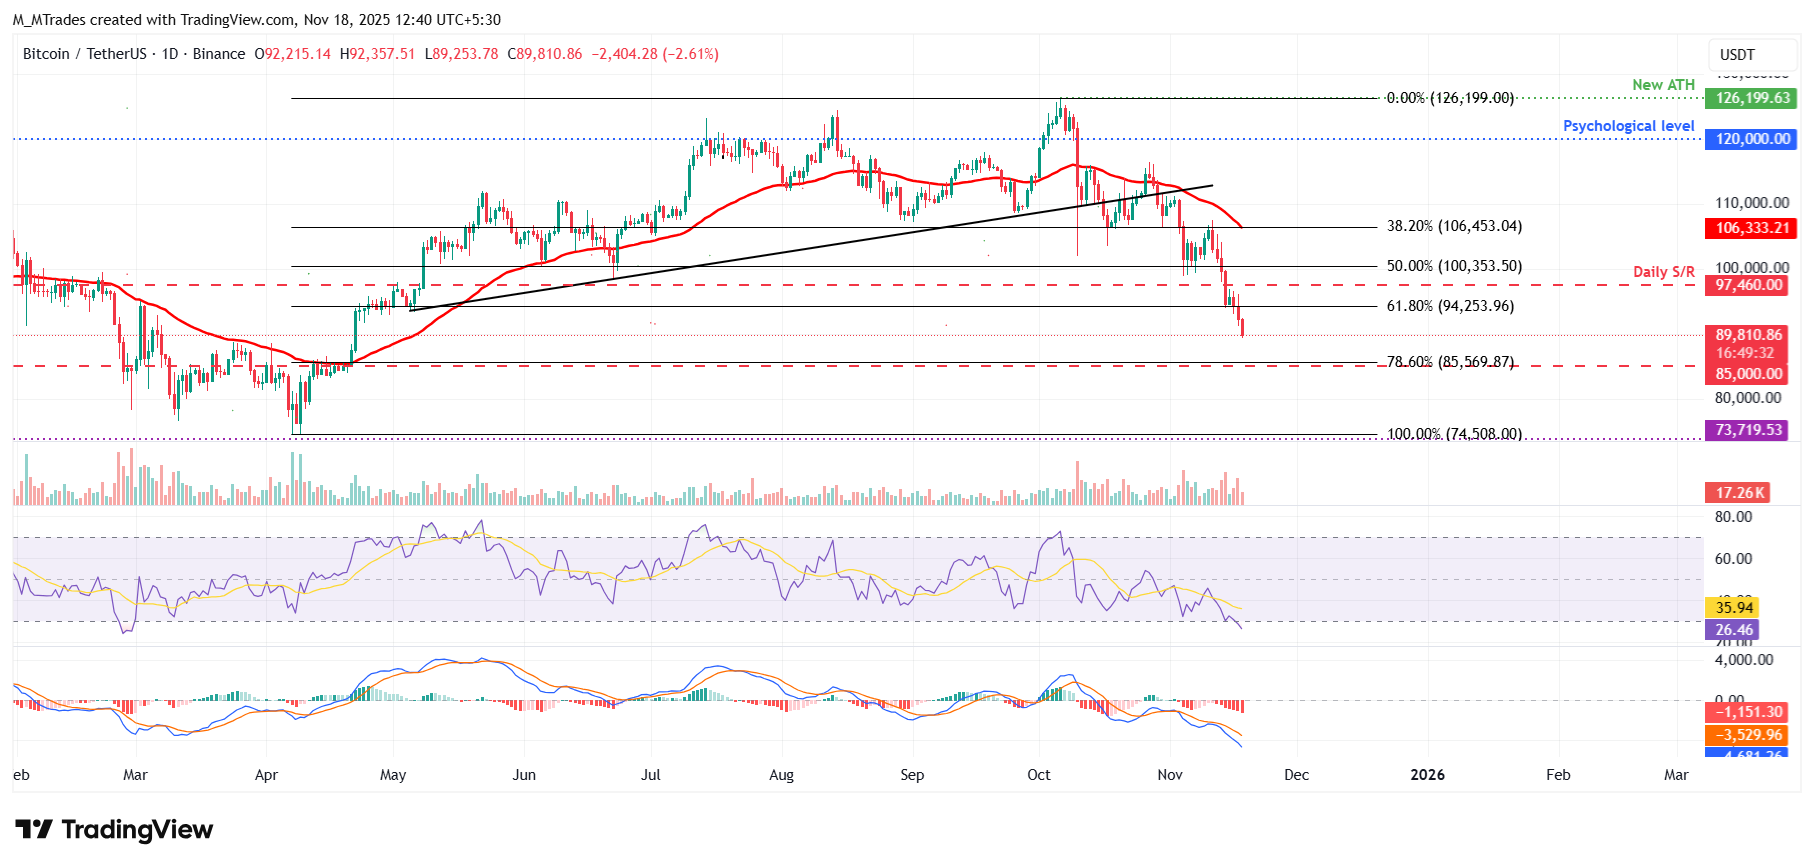
Bitcoin price extends its correction, trading below $90,000 on Tuesday following last week’s steep decline.
US-listed spot ETFs record an outflow of $254.54 million on Monday, extending last week's withdrawals.
On-chain metrics point to further downside, with rising reserves on exchanges, increasing deposit volume, and higher net exchange flows signaling mounting sell pressure.
Bitcoin (BTC) price slips below $90,000 at the time of writing on Tuesday, deepening its ongoing correction after last week’s sharp decline. The institutional demand also supports a bearish outlook as US-listed spot Bitcoin Exchange Traded Funds (ETFs) recorded $254.54 million in outflows on Monday, extending the persistent wave of withdrawals. On-chain indicators further support the bearish view, with rising exchange reserves, growing deposit volumes, and higher net exchange flows suggesting increased sell-side pressure.
ETF flows show ongoing weakness for Bitcoin
Bitcoin institutional demand continued to weaken. SoSoValue data shows that spot Bitcoin ETFs recorded an outflow of $254.51 million on Monday, continuing the four-day streak of outflow since November 12, after a total outflow of $1.11 billion since last week. If these outflows continue and intensify, BTC could extend its ongoing price correction, suggesting declining institutional confidence.

On-chain data further supports a bearish
On-chain data for Bitcoin shows that BTC has not yet found the bottom and has more downside room.
The graph below shows that the Average BTC Deposit Volume has surpassed 0.9 on Tuesday, signaling rising selling pressure. Historically, when Binance’s average deposit volume increased, Bitcoin’s price tended to react negatively.

Adding to the bearish outlook, the Binance Exchange Reserves have exceeded 580,000 BTC. When Bitcoin builds up on exchanges, it generally signals growing sell pressure, especially when demand is too weak to absorb the supply, as reflected by ongoing ETF outflows. This dynamic has acted as a bearish force recently, as rising Binance reserves have coincided with continued price weakness.

Moreover, the Net Exchange Flows metric continues to reflect bearish sentiment, with inflows surpassing 5,000 BTC on Monday — the strongest single-day sell pressure since mid-August.

Bitcoin Price Forecast: BTC bears aiming for $85,000 mark
Bitcoin price faced rejection at the 38.20% Fibonacci retracement level at $106,453 (drawn from the April 7 low of $74,508 to the all-time high of $126,299 set on October 6) last week and declined nearly 10%. On Monday, BTC declined and closed below the key support at $94,253. At the time of writing on Tuesday, BTC extends its losses, trading below $90,000.
If BTC continues its correction, it could extend the decline toward the next key support at $85,000.
The Relative Strength Index (RSI) on the daily chart is at 26, reinforcing the strong bearish momentum and signaling that BTC remains in deeply oversold conditions.

On the other hand, if BTC recovers, it could extend the recovery toward the 61.8% Fibonacci retracement level at $94,253.


