


Solana is trading at $86 on the daily chart as of May 22, sitting just below the Fibonacci 0.5 retracement level of the April-to-May rally while four separate technical conditions converge at the same price zone.
Key Takeaways
SOL at $86.37, sitting just below Fibonacci 0.5 resistance at $87.31.
SMA50 crossed above SMA100 on daily: bullish MA crossover confirmed.
Horizontal support at $84 has held multiple tests since April.
RSI at 47.28, signal at 54.39: momentum negative but approaching critical 50 level.
The Fibonacci Level and What It Means Here
The Fibonacci 0.5 retracement of the move from the April low near $76.45 to the May high near $97 places the midpoint at $86.7, consistent with the $87 level labeled on the chart. The price at the time of writing is $86.37, just below that level.
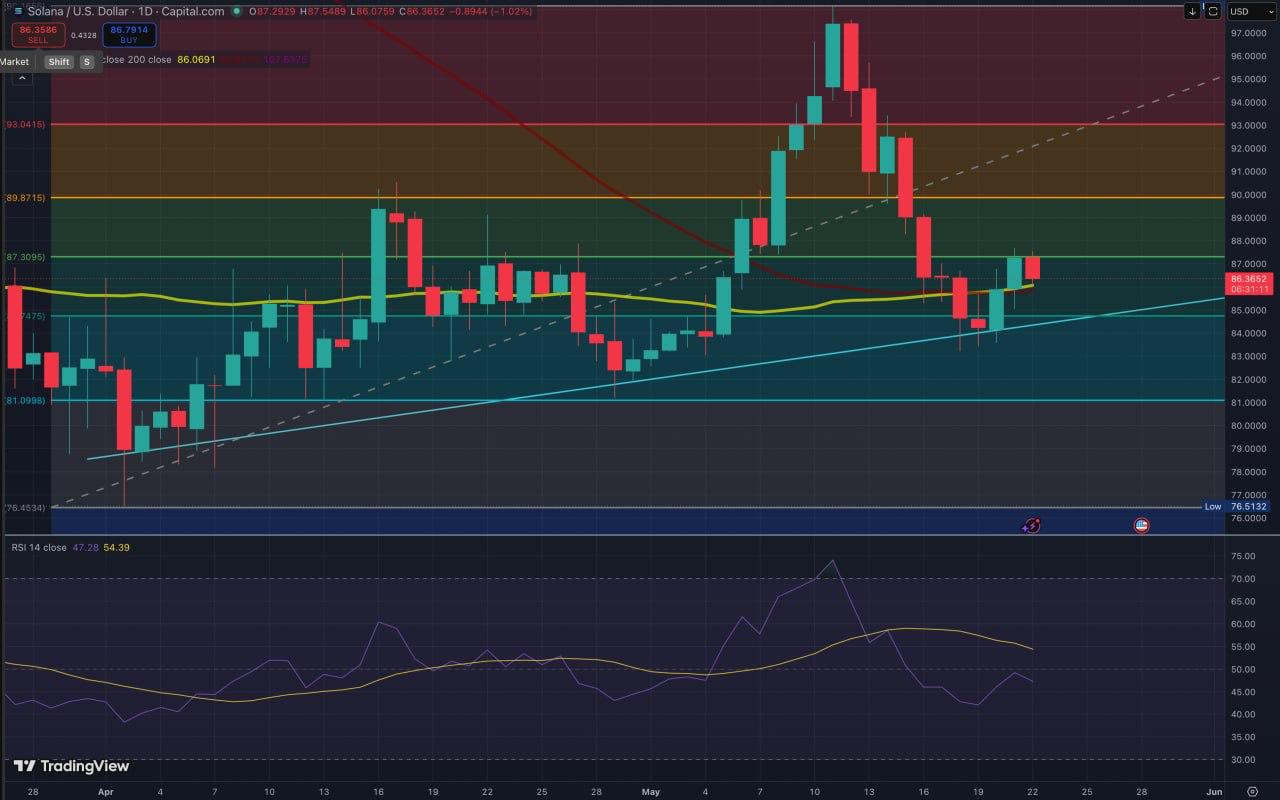
Analytically, Fibonacci 0.5 is the retracement level that separates the price range where the original trend is considered intact from the range where it is considered to have given back too much, making it the most structurally significant test in the current correction.
The Bullish MA Crossover Forming Underneath
A bullish SMA50/SMA100 crossover forming while price sits at the Fibonacci 0.5 level is not a coincidence of indicators: it is a compression of bullish structure and bearish price action at the same level, and the resolution of that compression will define the next 15-20% move in either direction.
The SMA50 has crossed above the SMA100 on the daily chart, confirming that the medium-term momentum structure has shifted in favor of buyers. Price is currently sitting at the SMA50, meaning the crossover is forming at the exact moment price is testing the MA cluster as support.
If price holds above the SMA50 and the two MAs continue diverging upward, the Fibonacci zone becomes a confirmed support retest. The next resistance levels above are $87.31, $89.87, and $93.04. If price breaks below the SMA50 and the crossover fails to hold, the bearish case accelerates because the signal that was meant to confirm the trend will have failed at its first structural test.
What the Volume Bubble Maps Add
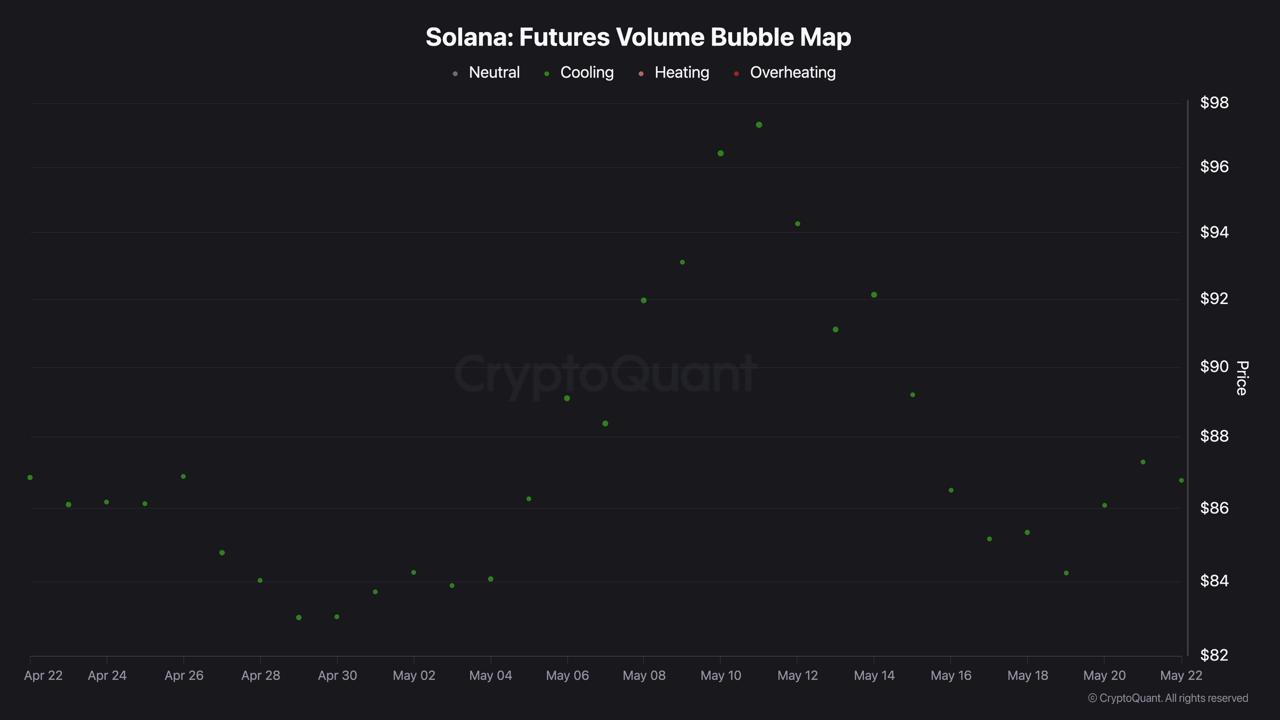
Both the spot and futures volume bubble maps showing exclusively cooling readings across a 30-day range that included a rally to $97 and a subsequent decline to $86 means neither the move up nor the move down was driven by speculative excess, which removes the overheating narrative as an explanation for the current price level. Every bubble across the entire April 22 to May 22 period is green on both maps, with no orange heating or red overheating readings. The bubbles grew in size as price approached the $97 peak and have shrunk as price declined, but the cooling classification held throughout.
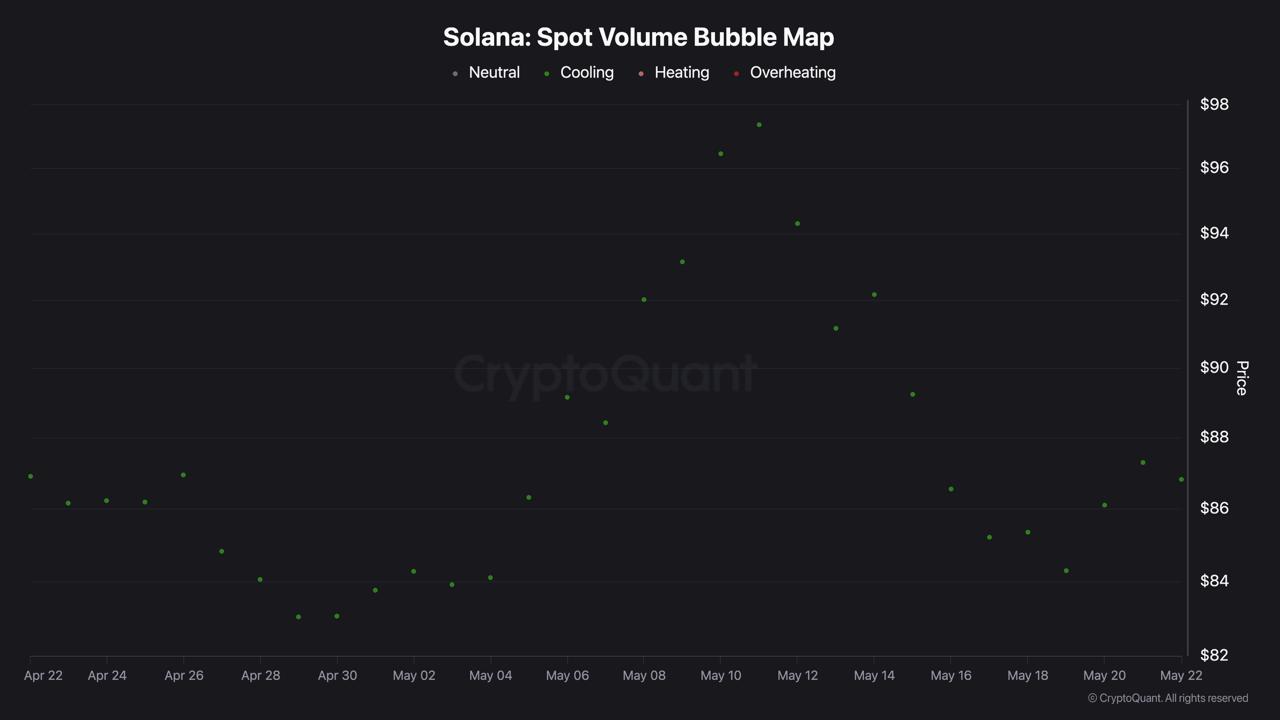
Solana’s decline from $97 to $86 does not represent a speculative blowoff unwinding. It represents a normal retracement from a rally that was never overheated, and the support zone at $84.75 is holding back normal selling from non-leveraged participants rather than a cascade of forced liquidations.
The Support Structure Below and the RSI
The horizontal support at approximately $84.75 has absorbed multiple tests since April, and its proximity to the current price means Solana is trading in a zone where the structural floor is $1.60 below the current level while the structural ceiling is $0.94 above it. Analytically, the ascending channel visible on the chart appears to originate near the late March lows, providing an additional rising support reference below the $84.75 horizontal.
RSI at 47.28 with signal at 54.39 confirms negative momentum on the daily with a 7.11-point spread. The RSI is approaching the 50 level from above, which is the momentum line that separates net-positive from net-negative daily conditions. A close back above 50 on the RSI with price reclaiming the Fibonacci zone would align momentum and structure simultaneously. A continued RSI decline below 40 with price breaking below $84.75 would invalidate both the SMA50/SMA100 crossover setup and the horizontal support argument in the same session.


