


XRP is compressing into a critical technical zone while its order book is the thinnest it has been in six years.
Key Takeaways
XRP trading at $1.3550, between Fibonacci 0.786 and 0.618
SMA50 at $1.3980 and SMA100 at $1.3958 converged to within $0.0022.
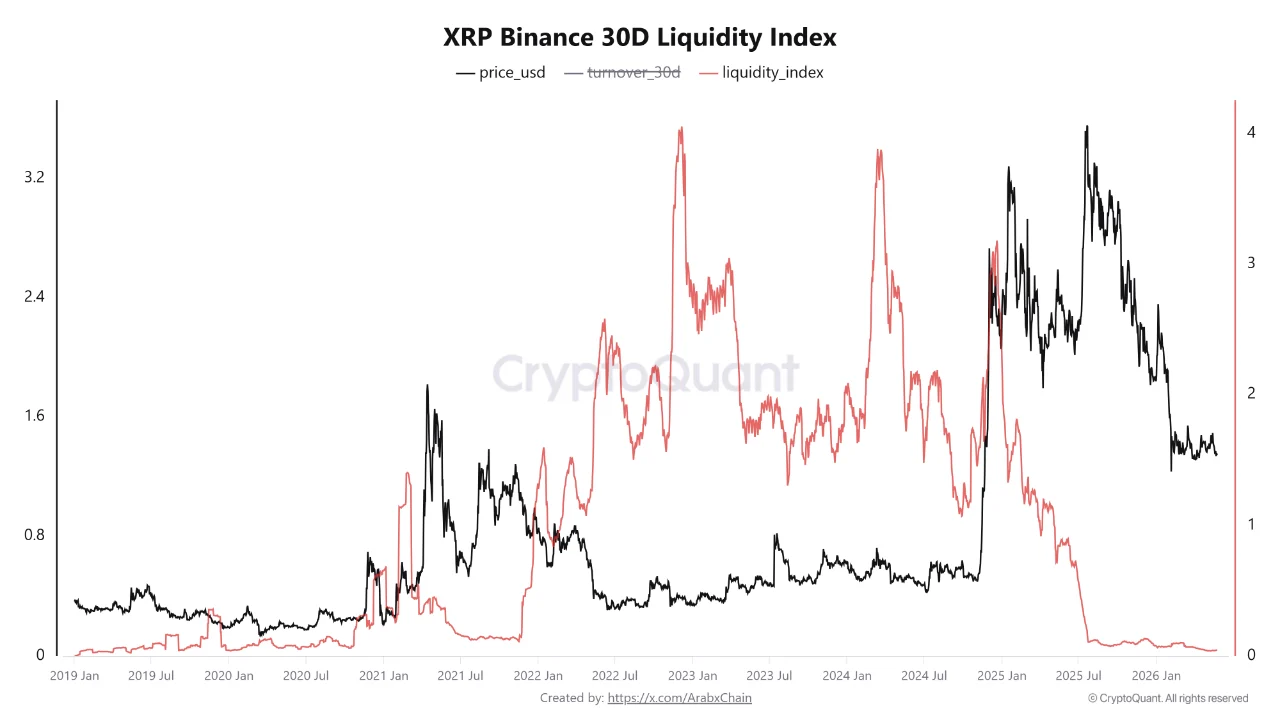
Liquidity index at approximately 0.043: lowest since January 2020.
Low liquidity amplifies next directional move regardless of direction
RSI at 42.80, signal at 46.92: momentum negative.
XRP is trading at $1.3550 as of May 25, sitting in the grey retracement zone between the Fibonacci 0.786 at $1.3366 and the 0.618 at $1.3822 while the XRP Binance 30D Liquidity Index has fallen to approximately 0.043, its lowest level since January 2020.
What the Two Charts Show Together
XRP’s liquidity index at its lowest level since January 2020 does not predict direction but it does predict amplitude: in a market where order book depth has collapsed to 0.043 from peaks above 4, any surge in volume from either buyers or sellers encounters less resistance than it would in a liquid market, meaning the next significant move will travel further and faster than it would under normal liquidity conditions.
The CryptoQuant 30D Liquidity Index chart shows a clear structural pattern: liquidity built from near-zero in 2020 into the elevated readings above 3 and 4 that characterized the 2022-2024 period of strong market activity. The current collapse back toward zero mirrors the 2020 baseline, though the source text notes this is not inherently bullish or bearish and reflects caution and anticipation rather than directional positioning.
The price chart places XRP in a Fibonacci compression zone with the 0.786 at $1.3366 as the floor and the 0.618 at $1.3822 as the ceiling. Price is $0.0184 above the floor and $0.0272 below the ceiling. The total range of the compression is $0.0456. In a liquid market, a $0.0456 range produces modest price action. In a market at a six-year liquidity low, the same range compresses potential energy that releases sharply when direction is determined.
The MA Structure Above and the Fibonacci Floor Below
The convergence of the SMA50 and SMA100 to within $0.0022 of each other at the $1.396-$1.398 level while price sits $0.04 below them creates a resistance ceiling that functions as a single level rather than two separate ones, and clearing it on a daily close would require a 3% move from current price in a market where liquidity is near a six-year low.
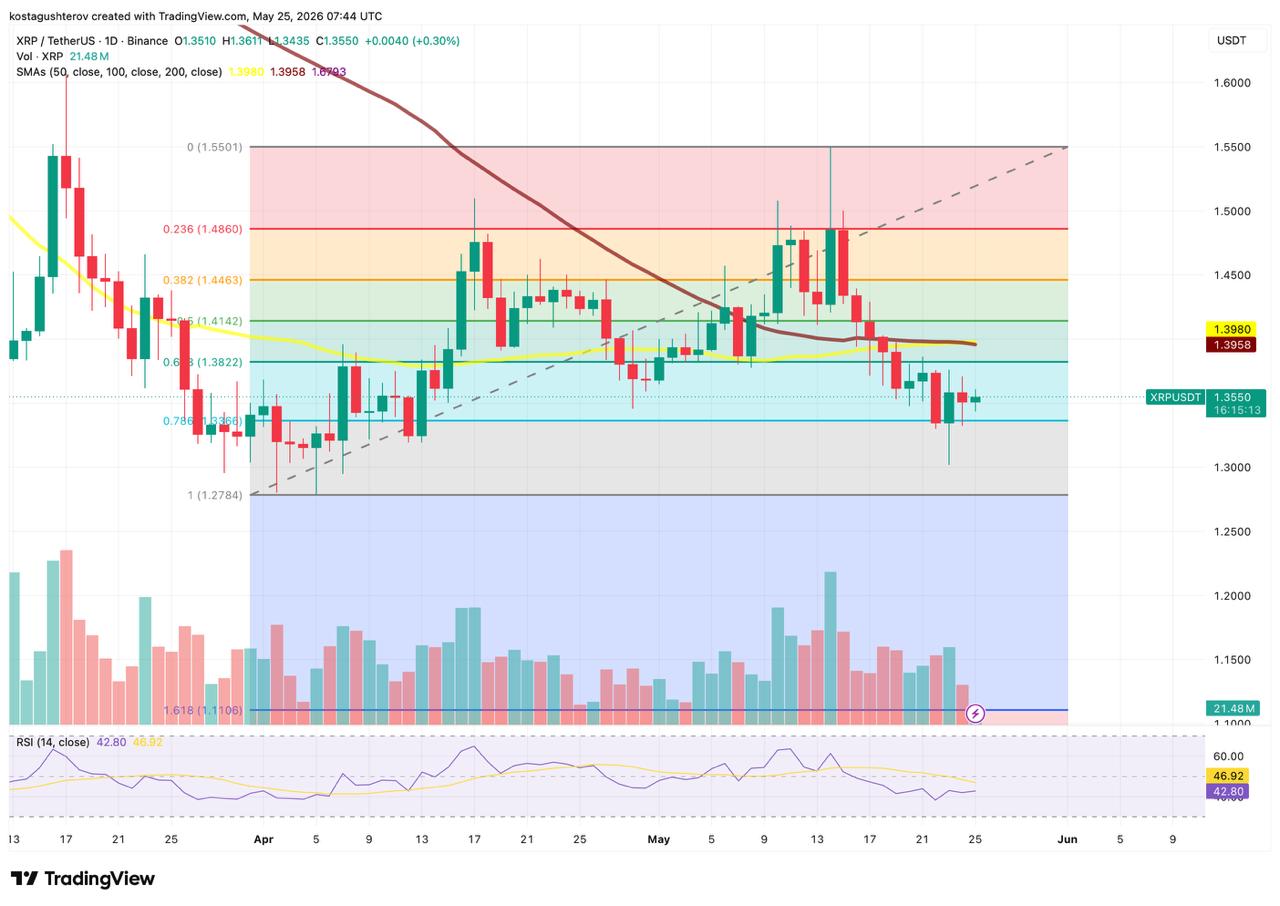
The SMA200 at $1.6703 is declining steeply and is not relevant to the immediate structure. RSI at 42.80 with signal at 46.92 confirms negative momentum with a 4.12-point spread. The RSI has not reached oversold territory, meaning there is no mechanical bounce condition active from the momentum indicator.
Below current price, the 0.786 at $1.3366 is $0.0184 away. A break below it brings the grey zone into full extension and the full retracement at $1.2784 becomes the next labeled support. The 1.618 Fibonacci extension at $1.1106 is also labeled on the chart as a blue horizontal line, indicating the downside extension target visible to the analyst who constructed this grid.
What the Liquidity Reading Means for the Next Move
The combination of a Fibonacci compression zone between $1.3366 and $1.3822, a converging MA ceiling at $1.396-$1.398, and a liquidity index near historical lows describes a market that is structurally coiled rather than structurally weak: the low liquidity is not distribution, it is the absence of participants on both sides, which is the condition that produces sharp moves when a catalyst breaks the equilibrium. The source text notes that low liquidity makes the market more sensitive to sudden price movements because large orders have greater impact on price due to the lack of market depth.
A daily close above the SMA cluster at $1.398 on volume meaningfully above the current 21.48M daily average would represent a breakout from the compression zone in a thin order book, conditions analytically associated with accelerated moves toward the 0.618 at $1.3822 and then the 0.382 at $1.4463. A break below the 0.786 at $1.3366 on above-average volume in the same thin liquidity environment would accelerate toward the full retracement at $1.2784 with similar speed.


